P&F Charts
Point and Figure Charts visually appear like a collection of X's and O's on a grid of square boxes. Columns of X's alternate with columns of O's. The X's represent a period of rising prices and the O's represent a period of falling prices.
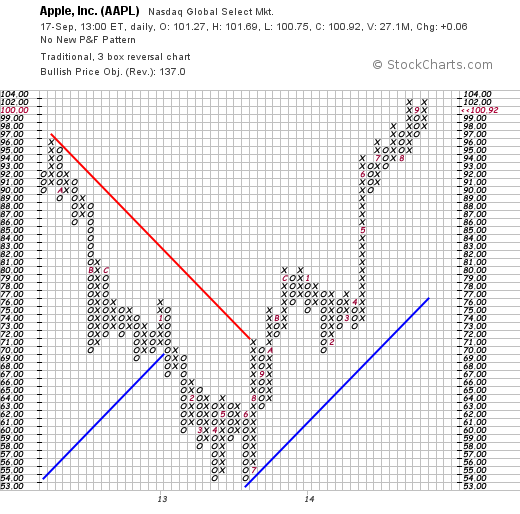
Here is an example of a Point and Figure chart:
For details on P&F charts - how they are constructed and how they are interpreted - please see our ChartSchool article on the topic.
On Technicalanalysis.com, P&F charts can be created with our �Point and Figure Workbench� page. The rest of this article is about using the P&F Workbench.
Creating P&F Charts
Similar to SharpCharts, you can create a P&F chart for any ticker symbol in our database by using the �Create a Chart� bar at the top of any of our web pages. First, change the dropdown from �SharpChart� to �P&F Chart�, then enter the ticker symbol you wish to chart, then press the �Go� button.
You can also create a P&F Chart by clicking on the �P&F Chart� link at the bottom of the SharpCharts Workbench.
You can also create a P&F Chart by clicking on the �P&F� icon located on most of our report pages - i.e. Market Summary, Sector Summary, etc. - and on our Scan Results pages.
Using The P&F Workbench
Once the P&F Workbench appears, you can change the settings for the chart just like you do on the SharpCharts Workbench. While not identical, the two workbenches work in a very similar manner.
At the top of the P&F Workbench, you specify the Ticker Symbol that you want to chart and then press �Update� (or the Enter key) to see the new chart.
Chart Attributes
Below the chart, you can change several Chart Attributes - i.e., setting that effect the entire chart. These include:
- Periods - the period of the bars used in creating the P&F Chart.
- Price Field - either �High/Low� or �Close Only.� Specifies whether or not to include highs and lows in construction of the chart.
- Chart Size - the width of the chart (in pixels).
- Color Scheme - the colors used to draw the chart.
- Show Price Plot - include a small version of the OHLC bar chart for the ticker symbol in the background of the P&F chart.
- Show Volume - include a volume histogram at the bottom of the chart. Each bar in the histogram represents the cumulative total of all volume that happened during the time the chart was creating the corresponding column of X's or O's.
- Show Reversal Marker - show the location of the next reversal for the chart given its current reversal settings.
Chart Scaling
The Chart Scale section allows you to change the conditions which cause reversals on the P&F chart.
- The Scaling Method dropdown allows you to change the way point sizes are chosen along the vertical scale of the chart. Here are the choices:
- Traditional scaling uses a fixed table of values (detailed here)
- Percentage scaling uses values that increase at a fixed percentage
- Average True Range scaling chooses a value based on the volatility of the chart which ensures that a �good looking� chart always appears. The value in the ATR Period field is used in that calculation.
- User Defined scaling uses the number in the Box Size field as the size of every box on the chart
- The Reversal box allows you to specify how many boxes are required to be filled before the chart reverses.
- The Scale Factor box allows you to divide the vertical scale by a fixed number (ex. 10 or 100) in order to use the traditional scaling rules on datasets with large values.
- The Decimal Places box lets you control the number of decimal places that appear on the vertical scale.
- The Price Objective dropdown lets you select which calculation method you'd like to use for the chart's price objective. See our ChartSchool article on Price Objectives for details.
Notes:
- Think of the �Average True Range� setting as the �Automatic� setting. It automatically shows you a chart with an �interesting� number of reversals on it.
- ATR-scaling will change the box-size it uses frequently. This means that P&F charts with ATR scaling can change significantly from day to day (sometimes from moment to moment).
Price Objectives can be easily misused! Please read our ChartSchool article on Price Objectives carefully before evaluating them.
Duration
The End Date setting lets you create a P&F chart that ends prior to the current date.
The Wide Chart checkbox lets you create a P&F chart that includes more historical data than normal.
Chart Overlays
There are several technical overlays that you can add to a Point & Figure chart using the dropdowns and parameter boxes in this section.
- P&F Trendlines automatically add 45-degree trendlines to the chart. They alternate between bullish (blue) and bearish (red) lines. A P&F trendline is in effect until it is violated.
- Simple Moving Average is calculated based on the midpoint of each column of X's and O's.
- Bollinger Bands
- are calculated based on the midpoint of each column of X's and O's.
- Price by Volume shows a horizontal histogram which each bar representing the cumulative volume for that price level. Note: The �Show Volume� checkbox must be checked in order for the �Price by Volume� histogram to appear.