ChartNotes
Overview
ChartNotes is our chart annotation tool that allows you to add annotations and technical line studies to any SharpChart.
Note: Because ChartNotes is so interactive, we recommend that new users watch the ChartNotes instructional videos before reviewing the rest of this article.
The general process for creating annotated charts is to first create a SharpChart using the SharpCharts Workbench and then click the �Annotate� link below the chart to bring up the chart inside the ChartNotes annotation tool. We recommend first ensuring that your chart's settings are correct before you start annotating it. After ChartNotes starts, it will load your chart and then allow you to add your annotations.
Note: Currently, ChartNotes requires the Adobe Flash browser plug-in in order to work. Note that Flash is only needed to create/modify annotations on a chart. Flash is not needed to view a chart that has already been annotated.
Below is a screenshot that shows what the top of the ChartNotes window looks like when it is up and running. The collection of tools along the top of the window are various drawing tools (described below). The controls on the left side of the chart allow you to change the properties of the current selected annotation.
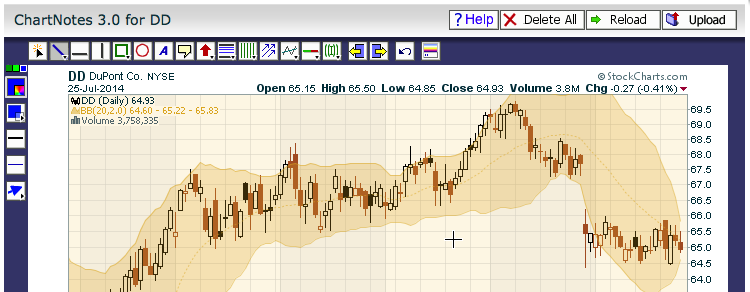
Members can save annotated charts into their account using the �Upload� button in the upper right corner of ChartNotes. Once an annotated chart has been saved, its annotations will automatically be repositioned as new data is added to the right side of the chart.
Working with Annotations
Adding Annotations
Once ChartNotes is running, a row of buttons will appear across the top of the chart. These buttons allow you to select a drawing tool. Once the tool is selected, you can click and drag on your chart to add a new annotation to the chart.
Note that drawing tool buttons with a small triangle in the lower right corner will display a stack of related tools when you move your mouse over them.
Selecting Annotations
After an annotation is placed on the chart, it can be selected using the �Select� tool (the leftmost button on the horizontal row of buttons at the top of the chart). When an annotation is selected, little yellow boxes called �handles� will appear on the outside edges of the annotation. You will also see various other options for modifying the selected annotation appear in the vertical margin next to the left side of the chart.
Duplicating Annotations
You can duplicate a selected annotation by pressing Control-D (Cmd-D on a Mac). The new annotation will appear slightly away from the original annotation and will be automatically selected so that you can immediately move it or resize it with your mouse.
Note: Some browsers will also display an unrelated dialog box when you press Cmd-D. If that happens, just press �Cancel� to dismiss that box.
Creating Channels via Duplicated Trendlines
There is an additional shortcut for quickly creating channel lines on a chart. Start by drawing the upper or lower channel line using the Line tool. Next, press and hold down the Control/Cmd key on your keyboard. Finally, click and drag on the line you just created. As you drag away from that line, a new parallel line will appear under your mouse. Simply move that line to the top/bottom of your channel and release your mouse button to create the channel.
Deleting Annotations
Once an annotation is selected, it can be deleted by pressing the �Backspace� (or �Delete�) key on your keyboard.
If you want to remove all annotations from a chart, click the �Delete All� button in the upper right corner of the ChartNotes window.
If you want to only remove the annotations you've added since the last time you saved your chart, click the �Reload� button in the upper right corner of the ChartNotes window.
Modifying Annotations
Once an annotation is selected, you can click and drag the yellow handles to resize and reposition the annotation. You can also click on the various options to the left of the chart to modify the annotation's attributes. The options that you can change vary depending on the annotation selected. They include:
- Color - The color of the annotation. Your most recently used 3 colors are always displayed at the top of the vertical margin for easy access.
- Opacity - How transparent an annotation is. A value of 1.0 means the annotation is non-transparent. A value of 0.0 means the annotation is completely transparent (i.e., invisible).
- Line Width - A toggle button that lets you cycle between 5 different line width options.
- Line Style - A toggle button that lets you cycle between 7 different line style options.
- Arrowheads - Lets you add one of 5 different arrowhead styles to a line.
- Fill Mode - Lets you toggle between 3 different approaches for filling in shapes: �Empty�, �XOR� and �Opaque�. �XOR� mode inverts the colors of anything inside the shape. �Opaque� mode fills in the shape based on the �Opacity� setting (see above).
- Corner Type - A toggle button that lets you round the corners of the rectangle shape.
- Font Size - Two buttons that let you increase or decrease the size of the letters in a text annotation.
- Font Bolding - A button that lets you toggle font bolding on and off.
Pinning Annotations
Typically, annotations are automatically repositioned whenever new price bars are added to the right edge of the chart. There are some situations however where you might not want your annotations to be moved. An example would be a block of text that is meant to serve as the chart's title. You might want that text to always remain in the center of the chart (for example).
To prevent an annotation from moving to the left over time, select the annotation with the Select tool and then click the �Pin� button (labelled �Absolute Positioning�) that appears in the vertical margin on the left side of the chart. When that button is depressed (i.e., when it has a gray background), your annotation will no longer move to the left as new data is added to the chart.
Saving Annotations
Members can click the �Upload� button in the upper right corner of the window to save the chart into one of their ChartLists. If the chart has never been saved before, a dialog box will appear asking for a name for the chart and the ChartList that it should be saved into. If the chart was previously saved, the old version will be overwritten with the new annotation changes when �Upload� is clicked.
Non-members cannot save annotation charts into their account (since they do not have an account), but they can use a screenshot tool to create a static snapshot of their annotated chart.
Automatic Annotation Repositioning
Once an annotated chart has been saved into an account, its annotations are automatically repositioned as new data is added to the chart. You can use the �Pin� button - see above - to disable that behavior for an individual annotation. It is important to note that annotations are repositioned based on changes to the vertical scale of the chart panel that they are �attached� to (i.e., the panel that contains the geometric middle of the annotation).
Types of Annotations
The annotation tools in ChartNotes are grouped into the following categories. Click on the appropriate link to learn more about each group of tools.