 morningstar search engine
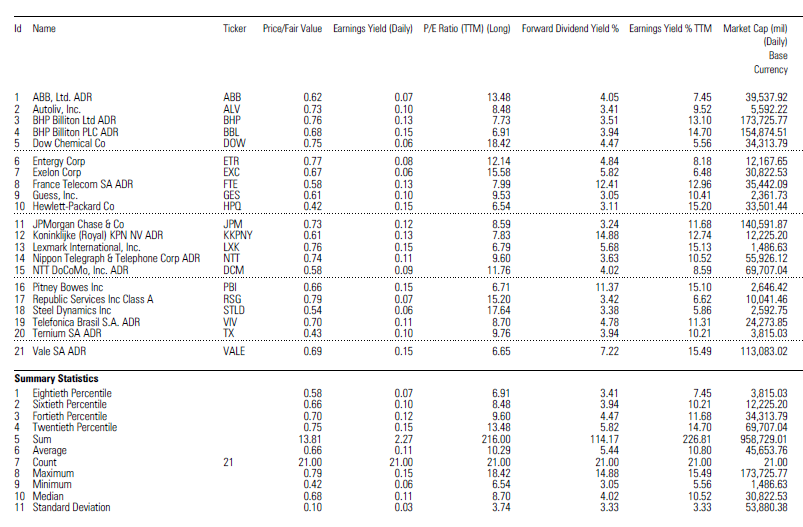
First, I use MorningStar program to filter my criteria; which are price/fair value <= 0.8, forward dividend yield >= 3, earning yield >= 5, price/book <= 5, price/sales >= 5, morning star rate overall >= 3, P/cash flow<= 15, cash return > 0, and cash flow >0). The reason I use these criteria is to evaluate the value stocks (underperformed). According to the Journal of Portfolio Management of Denis B Chaves and Robert D Arnott and the new finance book of Robert A Haugen, growth stocks sell at above-average prices relative to current cash flows, earning, dividends, and book values; and value stocks sell at below average prices relative to these numbers. Generally, the value stocks have greater returns than growth stocks in the long term investment. As a result, I have a list of 21 stocks (PPoint, slide 3).
 Valueline.com
BHP Billiton Limited NYSE -BHP
| Weighted Average Cost of Capital |
| Value Line Beta |
1.40 |
|
Long Term Debt |
18.713 |
| Yahoo Beta |
1.78 |
Long Term Interest |
900 |
| Average Beta |
1.59 |
Cost of Debt |
4.81% |
| Adjusted Beta |
1.39 |
Income Tax Rate(2017) |
34.00% |
| 20-Year Treasury Bond Yield |
3.38% |
After-Tax Cost of Debt |
3.17% |
| Expected Market Return |
9.00% |
Proportion of Equity |
90.69% |
| Cost of Equity |
11.21% |
Proportion of Debt |
9.31% |
| Share Outstanding |
2.660 |
Weighted Average Cost of Capital |
10.46% |
| Stock Price |
$68.49 |
Infinite FCFTF Growth |
4.19% |
| Market Value of Equity |
182.183 |
Average Annual P/E Ratio(2017) |
12.00 |
| Current and Projected Amounts |
12/31/12 |
12/31/13 |
12/31/14 |
12/31/15 |
12/31/16 |
12/31/17 |
| Working Capital |
$7.500 |
$9.000 |
$11.775 |
$14.550 |
$17.325 |
$20.100 |
| Capital Spending per Share |
|
$5.20 |
$5 |
$6 |
$6 |
$6 |
| Common Shares Outstanding |
2.600 |
2.575 |
2.550 |
2.525 |
2.500 |
| Long-Term Debt |
19.000 |
20.000 |
20.500 |
21.000 |
21.500 |
22.000 |
| Interst Payment |
|
962 |
986 |
1.010 |
1.034 |
1.058 |
| Free Cash Flows |
(Millions of Dollars) |
| |
|
12/31/13 |
12/31/14 |
12/31/15 |
12/31/16 |
12/31/17 |
| Net Profit |
23.000 |
24.450 |
25.900 |
27.350 |
28.800 |
| -Depreciation |
6.600 |
7.000 |
7.400 |
7.800 |
8.200 |
| Net Profit |
23.000 |
24.450 |
25.900 |
27.350 |
28.800 |
| -Increase in Woring Capital |
(1.500) |
(2.775) |
(2.775) |
(2.775) |
(2.775) |
| Capital Spending |
(13.520) |
(13.905) |
(14.280) |
(14.645) |
(15.000) |
| -New Borrowing |
1000 |
500 |
500 |
500 |
500 |
| -After-tax interest Payment |
635 |
651 |
667 |
682 |
698 |
| Stock Valuation |
9/11/2012 |
12/31/13 |
12/31/14 |
12/31/15 |
12/31/16 |
12/31/17 |
Fractional Years from Current Date |
|
1.31 |
2.31 |
3.31 |
4.31 |
5.31 |
| Free Cash Flows to Equity(FCFTE) |
15.580 |
15.270 |
16.745 |
18.230 |
19.725 |
| Terminal Value of FCFTE |
|
|
|
|
345.600 |
| Total FCFTE |
15.580 |
15.270 |
16.745 |
18.230 |
365.325 |
| Present Values of Total FCFTE |
13.562 |
11.952 |
11.785 |
11.536 |
206.746 |
| Market Value of Equity (FCFTE Method) |
256.713 |
| Stock Value(FCFTE) |
$96.51 |
| |
| Free Cash Flows to Firm(FCFTF) |
|
15.215 |
15.421 |
16.912 |
18.412 |
19.923 |
| Terminal Value of FCFTF |
|
330.621 |
| Total FCFTF |
15.215 |
15.421 |
16.912 |
18.412 |
350.544 |
| Present Values of Total FCFTF |
13.361 |
12.259 |
12.171 |
11.996 |
206.746 |
| Enterprise Value |
256.533 |
| Total Cash |
5.060 |
| Market Value of Firm |
261.593 |
| Total Debt |
28.330 |
| Market Value of Equity(FCFTF Method) |
233.263 |
|
Thompson/Firt Call Price Target |
| Stock Value (FCFTF Method) |
$87.69 |
High |
$96.00 |
| |
|
Mean |
$59.11 |
| Estimated Stock Value |
$92.10 |
Median |
$51.61 |
| 12-Month Target Price |
$102.43 |
Low |
$42.04 |
| Projected Return |
49.55% |
No of Brokers |
6 |
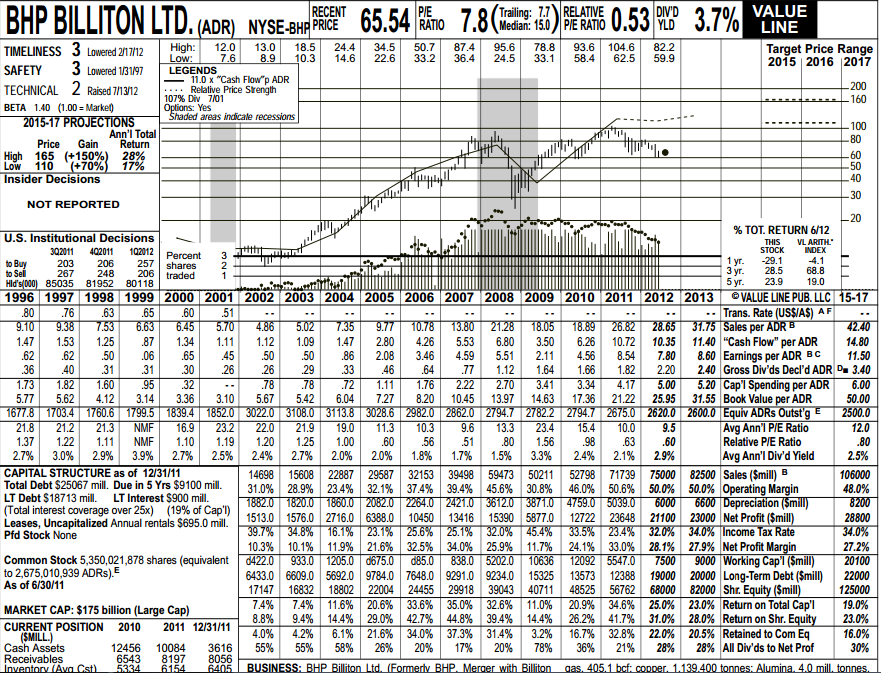
Next, I use the Valueline.com (PP, slides 5) to check the fundamental analysis and to support the excel analysis. Cash flow per ADR from 2009 to 2012 rises sharply after the financial collapse of 2008; and the stock is priced at 11x of cash flow. The dividend yield of 3.7% is also a favor factor for investors who look for income. Sales, EPS, Net Profits, average annual dividend, and working capital have a stable uptrend. The decrease in equivalent share outstanding is a good side of increasing the stock price. Moreover, the technical and safety valuation from Valueline are 2 and 3 [over the scale of 1 (best) � 5 (worst)], meaning that BPH is not a risky stock. Valueline shows that BHP�s financial strength is A; stock�s price stability is 50 (scale of 0-100), and growth persistence is 95 (scale of 0-100). So far, 2015-2017 BHP stock projection show that the predicted high price is 165 (gain 150% with 28% of annual total return and the predicted low price is 110 (gain 70% with 17% of annual total return).
 Option Chains
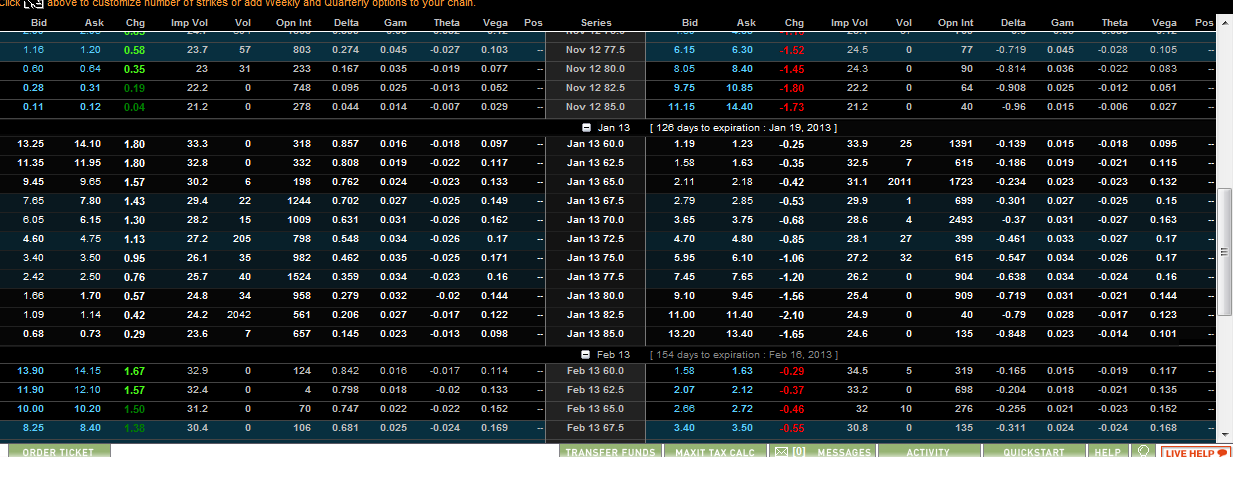
Third, I use the options chain to predict the stock price by identifying the resistance and support of option traders. Generally, in January 2013, option chains support at the price of $70 and resist at $77.5 (some resist at $85). In short, option traders favor the stock at the high price comparing to the current price.
 BHP Billiton Limited (BHP)
 Copper Chart
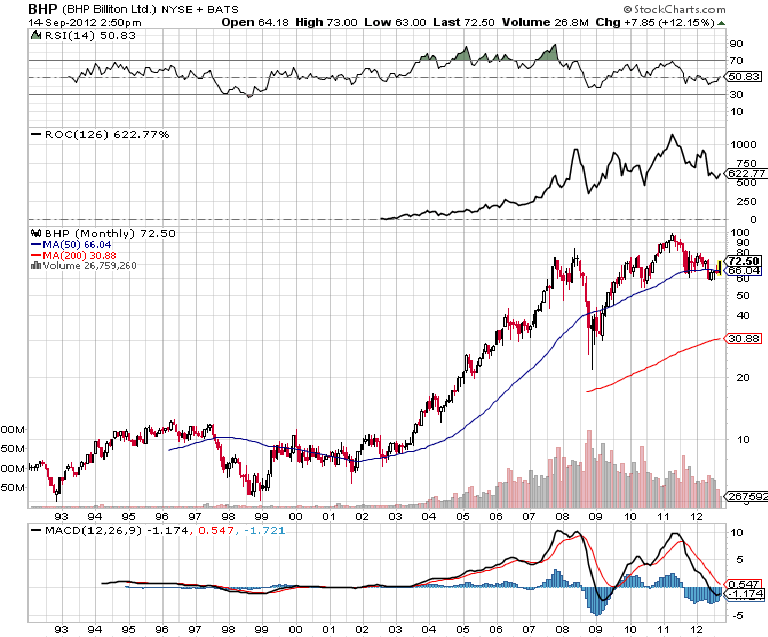
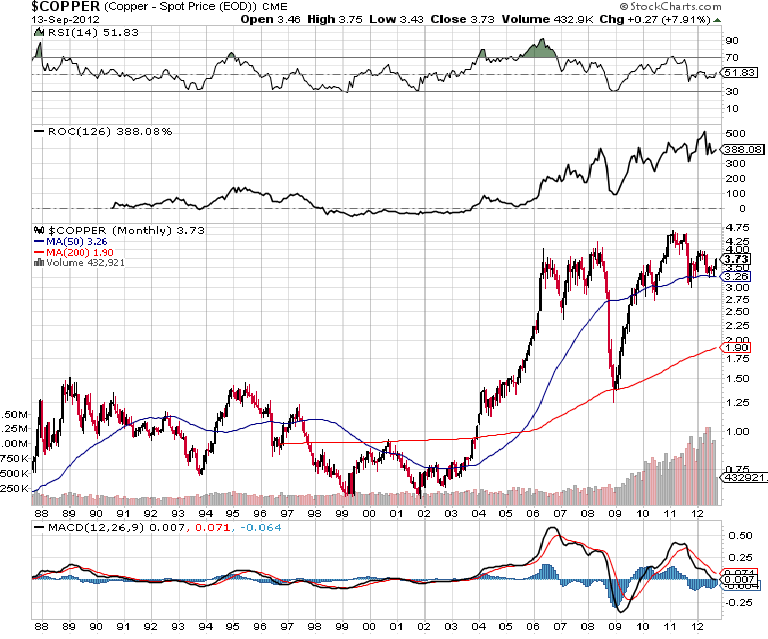
Finally, I use technical analysis to define the stock cycle, weekly pattern, risk, rate of change, volume, and stock trend. There is five years cycle in which the current year (4th) is consolidation pattern (PP, slide 9). There is limited risk because BHP BILLITON is strong uptrend till 2004. Rate of change of 10.2 years is 603% comparing to ROC of current 4 years is 52%. Also, the volume of trading BHP is very high. It means that investors still pay attention to this stock. Although average true range is high but the Bollinger band width is low (less risky). As a result, BHP is a good stock in the next 5 years. Further, BHP is diversified natural resources, especially in copper and iron; therefore, copper price is very much affecting the BHP stock price. Copper price is increasing sharply with very high ROC of 10 years; and the housing market will recovery in the future (according to the Barron�s newspaper, the housing market is up 7% since 2010).
 Barron News
In conclusion, BHP BILLION LIMITED is a great company to invest in the long term because the value of company which is less risk and high return. My prediction is if the stock price breaks at $75(current price quoted at $72.88 in September 14th, 2012); then, the stock will be bullish in the next 5 years.